|
||||||||||
|
||||||||||

HyPer
SUPPORT |
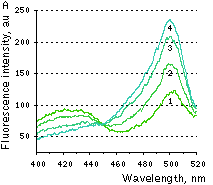
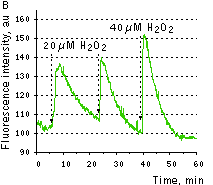
Hydrogen peroxide sensor HyPer- Ratiometric detection of intracellular H2O2 level changes Performance and useWithout H2O2 HyPer has two excitation peaks with maxima at 420 nm and 500 nm, and one emission peak with maximum at 516 nm. Upon exposure to H2O2, the excitation peak at 420 nm decreases proportionally to the increase in the peak at 500 nm, allowing ratiometric measurement of H2O2. Similarly to wild-type OxyR, oxidized HyPer can be reduced inside cells.
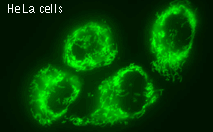
HyPer can be directly expressed by target cells individually or in fusion with a specific localization signal. It successfully folds and remains highly sensitive to hydrogen peroxide both in bacteria and in mammalian cells. If required, stable HyPer transformants can be selected using G418 [Gorman, 1985]. HyPer suitability to generate stably transfected cells has been proven by Marinpharm company.
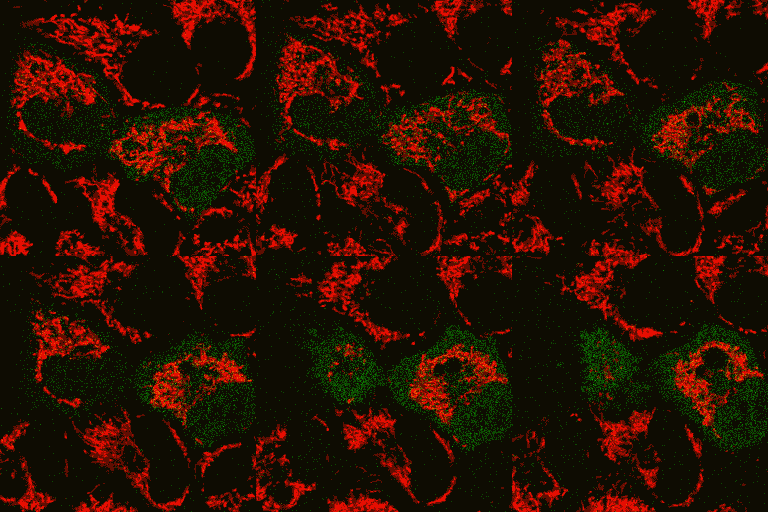
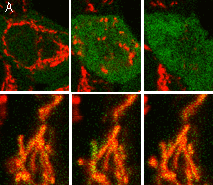
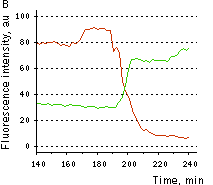
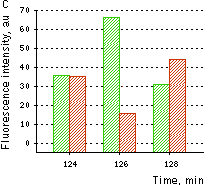
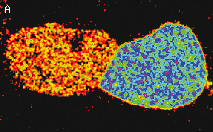
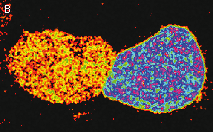
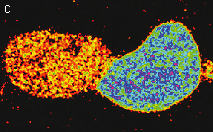
HyPer can be used for monitoring and ratiometric measurement of hydrogen peroxide production in living cells under various physiological and pathological conditions. Violet and blue excitation light should be applied for monitoring HyPer green emission changes caused by intracellular H2O2 production. Excitation light intensity must be individually determined for a particular biological system and instrumentation used. Note: Yellow fluorescent core of HyPer undergoes partial photoconversion to a dark state upon irradiation with blue light. It means that an apparent "bleaching" effect occurs at the beginning of time series imaging of cells expressing HyPer protein. Unlike the real bleaching, in the case of HyPer, signal drops to the level of dynamic equilibrium between fluorescent and dark state of the chromophore, and then remains stable. Visualization of hydrogen peroxide production in cytoplasm and mitochondria of HeLa cells during Apo2L/ TRAIL-induced apoptosis: HyPer was targeted to the cytosol of HeLa cells to visualize the hydrogen peroxide production in the cells exposed to the apoptogenic protein Apo2L/TRAIL. The cells were also loaded with tetramethylrhodamine methyl ester (TMRM, 20 nM) to monitor the mitochondrial transmembrane potential.
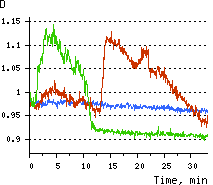
Upon stimulation with Apo2L/TRAIL (400 ng/ml), HeLa cells degradation occurred. At 3-5 hrs after Apo2L/TRAIL addition, the cells were observed to change their shape from flat to round with plasma membrane blebs. Using simultaneous visualization of HyPer and TMRM fluorescence, we observed that cytosolic H2O2 started rising in parallel with a loss of the mitochondrial transmembrane potential and a change in the cell shape. To study changes in the hydrogen peroxide level in mitochondria of HeLa cells treated with Apo2L/TRAIL, mitochondria-targeted HyPer was used. At 1-2 hrs after Apo2L/TRAIL addition, the transmembrane potential of some mitochondria started to oscillate. Simultaneous visualization of HyPer and TMRM fluorescence reveals rising of the H2O2 level during depolarization and decrease of the H2O2 level during repolarization of the mitochondria. Hydrogen peroxide detection during physiological stimulation: To demonstrate HyPer suitability for detecting low concentrations of H2O2 generated upon physiological stimulation, PC-12 cells which expressed HyPer in the cytoplasm were treated with the nerve growth factor (NGF). H2O2 level in the cytoplasm of stimulated cells was monitored under the same visualization conditions as in the experiment above, but with a higher scanning rate (1 frame per 3 seconds). Two patterns of cellular response were observed for 22 cells in 4 particular experiments. In most cells, H2O2 level started to increase almost immediately after growth factor addition and reached maximum in 3-7 min with the following decrease to the initial level in 10-20 min. Some cells demonstrated biphasic kinetics of hydrogen peroxide production. In such cells, slight initial transient H2O2 level increase was followed by the second higher and rapid increase in H2O2 production; then HyPer fluorescence gradually decreased to the initial level.
References:
|
|||||||||||||||||
|
Copyright 2002-2023 Evrogen. All rights reserved. Evrogen JSC, 16/10 Miklukho-Maklaya str., Moscow, Russia, Tel +7(495)988-4084, Fax +7(495)988-4085, e-mail:evrogen@evrogen.com |


