
|
||||||||||
|
||||||||||


Katushka2S
SUPPORTRESOURCES |
|
||||||||||||||||||||||||||||||||

 |  | |
|---|---|---|
|
| ||
 |  | |
|---|---|---|
|
| ||
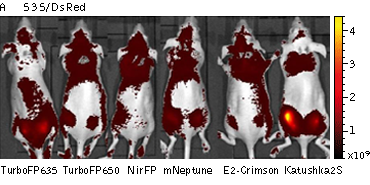
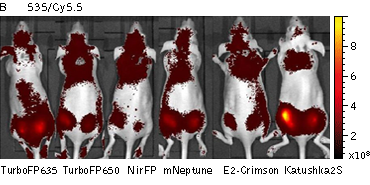
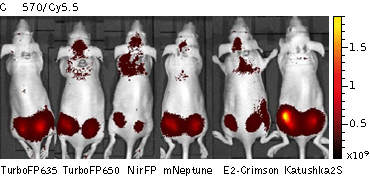
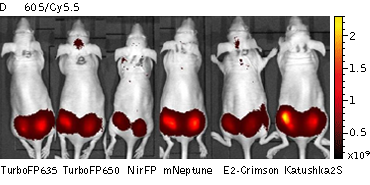
Whole-mouse imaging with IVIS Lumina II system (PerkinElmer).Representative fluorescence images of nude mice injected into the gluteal muscle with HEK293FT cells transiently expressing mNeptune, E2-Crimson, Katushka2S, TurboFP635, TurboFP650 and NirFP captured with indicated excitation (35-nm bandwidth centered at the indicated wavelength) and emission (DsRed 575-650nm and Cy5.5 695-770nm) filter combination. Pseudocolor scale bar: radiant efficiency (photons/s)/(µW/cm2). Note that scale bar differ for images with different excitation and emission filters. Images from [Luker et al., 2015] |
 |  |  | |
|---|---|---|---|
|
| |||
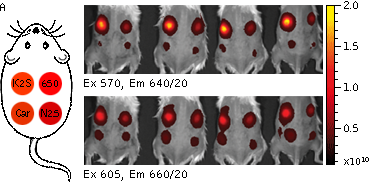
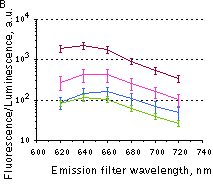
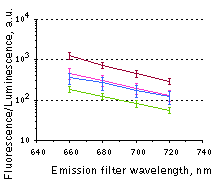
Whole-mouse imaging with IVIS Spectrum system (PerkinElmer).(A) Representative fluorescence images of mice injected in backs with HEK293FT cells transiently expressing Katushka2S (K2S), TurboFP650 (650), mCardinal (Car) and mNeptune2.5(N2.5). captured with indicated excitation (35-nm bandwidth centered at the indicated wavelength) and emission (640/20 and 660/20) filter combination. Pseudocolor scale bar: radiant efficiency (photons/s/cm2/sr)/(µW/cm2). (B) Graphs display mean values ±SEM for fluorescence radiant efficiency normalized to luciferase photon flux for each implant (n=4 per condition) for 570-nm (left) and 605-nm (right) excitation and listed emission filters. Fluorescent proteins are depicted by the following colors: Katushka2S (brown), TurboFP650 (pink), mCardinal (blue) and mNeptune2.5 (green). Images from [Luker et al., 2015] |
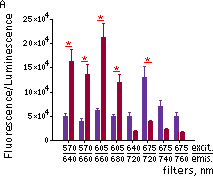
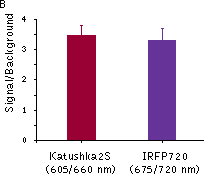
Katushka2S was also compared with one of the best phytochrome photoreceptors iRFP720. Katushka2S produced brighter fluorescence intensity at its optimum conditions as compared with the best output from iRFP720. At the same time, both proteins showed comparable signal-to-noise ratios at the optimum wavelengths for excitation and emission since autofluorescence from mouse tissue was lower in the channel optimal for iRFP720.
 |  | |
|---|---|---|
|
| ||
Fluorescence signals acquired with IVIS Spectrum system (PerkinElmer).Fluorescence signals normalized to corresponding firefly luciferase luminescence in mice injected in backs with HEK293FT cells transiently expressing Katushka2S or iRFP70. (A) Pairwise comparisons of the signals from Katushka2S (brown) and iRFP720 (violet) at different excitation/emission wavelengths. * p<0.0005 (B) Signal-to-noise ratios at optimal excitation and emission wavelengths for each protein. |
Note: Katushka2S demonstrates lower photostability than its parental variant TurboFP635. It may limit Katushka2S utility in cell culture experiments, but not in whole body imaging, where scattering and absorption of light naturally limit excitation power [Leblond et al., 2010].
References:
- Leblond F, Davis SC, Valdes PA, Pogue BW. Pre-clinical whole-body fluorescence imaging: Review of instruments, methods and applications. J Photochem Photobiol B. 2010; 98 (1):77-94. doi: 10.1016/j.jphotobiol.2009.11.007 / pmid: 20031443
- Luker KE, Pata P, Shemiakina II, Pereverzeva A, Stacer AC, Shcherbo DS, Pletnev VZ, Skolnaja M, Lukyanov KA, Luker GD, Pata I, Chudakov DM. Comparative study reveals better far-red fluorescent protein for whole body imaging. Sci Rep. 2015; 5 :10332. doi: 10.1038/srep10332 / pmid: 26035795
|
Copyright 2002-2023 Evrogen. All rights reserved. Evrogen JSC, 16/10 Miklukho-Maklaya str., Moscow, Russia, Tel +7(495)988-4084, Fax +7(495)988-4085, e-mail:evrogen@evrogen.com |